Spendwise
Spendwise is a personal expense tracker I designed and built end to end. It tries to answer one question properly — can I afford the rest of this month — rather than just listing what already left the account. A calendar shows per-day spend, reports break the same date range down by day, month, year, and category, and a forecast projects forward from average income. It installs as a PWA, and nothing is locked in: everything exports to CSV or Excel.
Problem
Most expense trackers report what you spent, which is the least actionable number available — it's history. The figure that actually changes a decision is how much is safe to spend for the rest of the month, and that needs income, bills still coming, and budgets in the same view, not a ledger. The second problem is friction: if logging a ৳30 rickshaw fare standing on the street takes more than a couple of taps, the log goes stale and every number built on it becomes fiction.
Approach
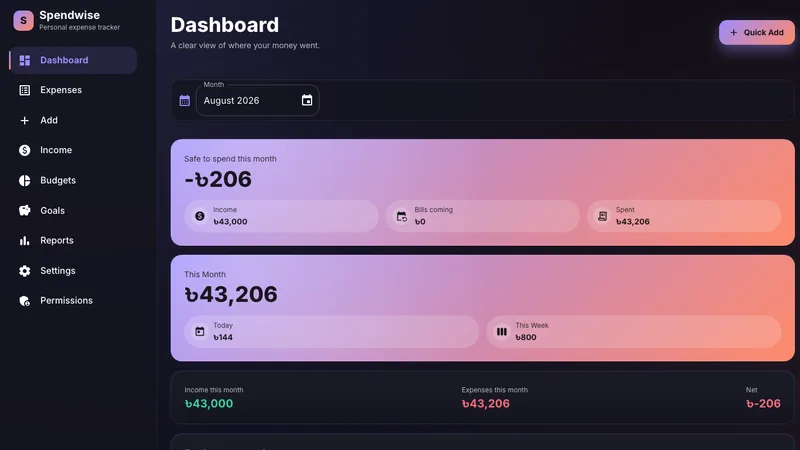
The dashboard leads with 'safe to spend this month' — income minus bills coming minus spent — so the headline number is a decision rather than a receipt. Capture is built for the street case: a persistent Quick Add plus a dedicated Add route. The whole thing ships as a PWA so it installs to the home screen and opens like an app rather than a tab. Zod schemas guard every form and API boundary, which is ceremony worth paying for when the domain is money. Reports all derive from one date range, so the daily, monthly, yearly, and category views can never disagree with each other.
Outcome
The free tier carries unlimited expenses and categories, the dashboard and calendar, full reports, CSV and Excel export, and light/dark themes, with recurring expenses and multi-currency staged behind a planned Pro tier. The forecast projects 30, 60, or 90 days from average income and names the projected low point and the date it lands on.
Highlights
- 01'Safe to spend this month' as the headline figure — income minus bills coming minus spent — instead of a raw total
- 02Month calendar with per-day spend, beside today / this week / this month / this year / last 30 days rollups
- 03Cash-flow forecast across 30, 60, or 90 days from average income, flagging the projected low point and its date
- 04Budgets with at-a-glance progress, including over-budget states
- 05Savings goals, and income tracked as a first-class section so the net position is real rather than expense-only
- 06Reports over any custom date range — daily, monthly, yearly, and per-category breakdowns driven off one range
- 07Color-coded, icon-driven categories: bills, groceries, transport, loan repayment, savings and more
- 08Quick Add plus a dedicated Add route, so logging a small cash expense takes a couple of taps
- 09CSV and Excel export — no data lock-in
- 10Role-based permissions and an admin area
- 11Installable PWA with light and dark themes
Screens
Walk through the build
Next up